The Duravant family of operating companies serve the food processing, packaging and material handling segments.

In 2026, the best food packaging automation solutions will not be defined by speed alone. They will combine accurate dosing, hygienic design, dependable robotics, and clear production data. A modern line may move sealed trays from a filling machine to a vision-guided pick-and-place robot. It may also adjust film tension when humidity changes. Small details matter.
Sean Riley, Senior Director of Media and Digital Strategy at PMMI, has emphasized a practical industry view: “Automation is not simply about replacing labor; it is about improving consistency, safety, and production flexibility.” This principle remains useful when evaluating food packaging automation suppliers. The strongest systems should reduce repetitive handling while helping operators monitor quality and respond to disruptions.
The 2026 market will likely favor modular equipment. Manufacturers can upgrade conveyors, checkweighers, case packers, labeling units, and palletizers without rebuilding an entire facility. That sounds efficient. It is not always simple.
Integration problems remain common. Software from different vendors may not communicate smoothly. Cleaning access can be overlooked. Operators may receive impressive dashboards but little useful training. These weaknesses deserve attention before purchase.
A reliable solution should demonstrate stable performance with the actual product, package size, speed, and washdown conditions. Factory acceptance tests provide evidence, but they do not reveal every factory-floor problem. Experience still matters.
This guide compares leading food packaging automation solutions through productivity, hygiene, safety, maintenance, scalability, and total operating cost. The “best” system is rarely the most expensive one. It is the system that performs consistently, supports people, and remains practical after installation.
Food Packaging Automation in 2026: Scope and 7.1% CAGR
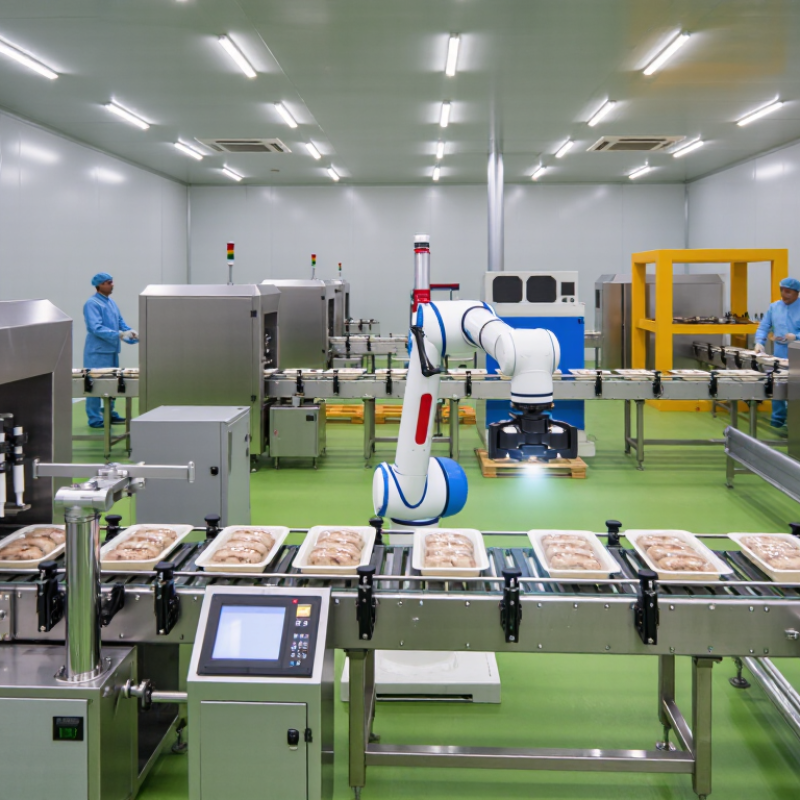
Food packaging automation covers filling, weighing, sealing, labeling, inspection, and case packing. It also includes sensors, robotic handling, and production software. Grand View Research projects a 7.1% compound annual growth rate for the food packaging automation market. This figure signals expanding demand, not guaranteed returns for every factory. Market scope can vary by equipment type, region, and forecast period.
In daily production, automation helps maintain portion accuracy and steady sealing pressure. It can reduce repetitive lifting and expose defects before products reach distribution. A camera may detect a weak seal. A checkweigher may stop an underfilled pouch. Small details matter. However, fast equipment can magnify poor upstream processes. Wet floors, inconsistent ingredients, or weak operator training still create downtime. I would not treat automation as a cure-all. A practical assessment should examine changeover time, cleaning access, software support, spare parts, and worker safety. Trial runs with real products often reveal problems that brochures miss. One line may handle dry snacks well but struggle with sticky sauces. That limitation deserves attention. In 2026, the strongest solutions will likely balance speed, traceability, hygiene, and flexible format changes. The 7.1% CAGR suggests investment momentum, while each purchase still requires measured testing, documented performance targets, and honest review of maintenance skills.
2026 Best Food Packaging Automation Solutions?
Core Technologies: 541,302 Robots Installed Globally in 2023 (IFR)
The International Federation of Robotics reported 541,302 robots installed worldwide in 2023. This figure shows how quickly automation is entering production environments. Food packaging plants now use robotic pickers, vision systems, conveyors, checkweighers, and automated case packers.
A delta robot can place small snack packs into trays at high speed. Cameras inspect seals, labels, and product positions before cartons leave the line. Collaborative robots can assist with palletizing where floor space is limited. These systems also record production data, helping operators trace batch movement and detect repeated faults.
Speed alone is not enough.
A reliable solution must support sanitation, safe food-contact materials, clear maintenance access, and controlled software updates. Equipment should also match the product’s shape, weight, temperature, and packaging film. A machine designed for rigid containers may struggle with soft pouches.
Small tests matter. During commissioning, teams should measure jams, changeover time, reject rates, and cleaning duration. A line can appear efficient during a demonstration, yet perform poorly beside a wet conveyor or unstable cartons. Automation does not repair weak plant layouts. It can expose them faster.
Human review remains essential. Operators understand unusual product behavior that sensors may miss. The best 2026 strategy may be selective automation, not maximum automation. Use robots where consistency creates value, while keeping practical flexibility where products frequently change.
Core Technology Benchmark: Global Industrial Robot Installations, 2013–2023
Global industrial robot installations reached 541,302 units in 2023, according to the International Federation of Robotics (IFR). This installed-robot base supports automation applications used in food packaging, including case packing, palletizing, pick-and-place, inspection, and material handling.
Source: International Federation of Robotics (IFR), World Robotics reports. Values are rounded historical global installation figures; 2022 and 2023 values are reported figures.
Choosing a food packaging line requires more than chasing speed. The 85% OEE benchmark is widely treated as a world-class reference. OEE combines availability, performance, and quality. A line producing 120 packs per minute may still underperform when changeovers consume 45 minutes.
World Robotics 2024 reported 541,302 industrial robots installed globally in 2023, a 10% annual increase. This growth shows automation is expanding, but robotics alone cannot guarantee throughput. Specify target packs per minute, acceptable rejects, sanitation time, and recovery speed after jams. A practical trial should run with real film, actual product variation, and trained operators.
Do not trust one impressive shift.
Food lines often lose output through small stops: misaligned trays, sensor dust, weak seals, or manual inspection delays. Track these losses separately. Then compare planned production time with good units produced. The result may reveal 68% OEE, not 85%. That is disappointing, but useful. An honest baseline supports better equipment decisions than a polished demonstration. Performance should be verified over several shifts, including cleaning, format changes, material replenishment, and ordinary operator mistakes.
| Evaluation Area | Metric or Line Type | Reference Value | How It Is Calculated or Used | Automation Priority |
|---|---|---|---|---|
| Core OEE and Performance Benchmarks | ||||
| Overall Equipment Effectiveness | World-class reference point | 85.0% | OEE = Availability × Performance × Quality. The 85% level is a demanding reference benchmark, not a universal requirement for every line. | Use as a long-term improvement target after product mix, changeovers, sanitation, and staffing constraints are measured. |
| Availability | World-class reference profile | 90.0% | Run time divided by planned production time. It reflects breakdowns, setup, changeovers, waiting, and other downtime. | Prioritize preventive maintenance, quick-change tooling, fault diagnostics, and spare-parts readiness. |
| Performance | World-class reference profile | 95.0% | Actual ideal-cycle output divided by the maximum possible output during run time. It captures minor stops and reduced-speed operation. | Prioritize automatic speed control, product-flow monitoring, accumulation, and root-cause analysis of micro-stops. |
| Quality | World-class reference profile | 99.5% | Good units divided by total units produced. Rework and rejects reduce the quality component of OEE. | Prioritize checkweighers, vision inspection, seal monitoring, reject verification, and closed-loop process control. |
| Combined benchmark example | 90% availability × 95% performance × 99.5% quality | 85.1% OEE | 0.90 × 0.95 × 0.995 = 0.8507, rounded to 85.1%. | Track each component separately; a single OEE percentage does not identify the source of lost capacity. |
| Illustrative Throughput Planning by Packaging Format | ||||
| Flexible pouch line | Nominal speed | 180 packs/min | At 85% OEE and an 8-hour scheduled shift: 180 × 480 × 0.85 = 73,440 good packs. | Automatic film tracking, seal inspection, multi-lane filling, and reject handling. |
| Tray-sealing line | Nominal speed | 120 trays/min | At 85% OEE and an 8-hour scheduled shift: 120 × 480 × 0.85 = 48,960 good trays. | Automatic denesting, filling control, gas-flush monitoring, sealing, and leak detection. |
| Cartoning line | Nominal speed | 90 cartons/min | At 85% OEE and an 8-hour scheduled shift: 90 × 480 × 0.85 = 36,720 good cartons. | Servo synchronization, carton-forming control, product presence checks, and case packing. |
| Case-packing line | Nominal speed | 35 cases/min | At 85% OEE and an 8-hour scheduled shift: 35 × 480 × 0.85 = 14,280 good cases. | Robotic pick-and-place, automatic case erecting, pattern changeover, and palletizing. |
| Line Selection Criteria for 2026 Automation Projects | ||||
| Changeover capability | Format or recipe change | Target: under 30 minutes where product design permits | Measure from the last acceptable unit of one product to the first acceptable unit of the next product. | Use recipe management, tool-less adjustments, guided setup, and digital changeover checklists. |
| Data visibility | Production and loss tracking | Real-time OEE by line, shift, product, and downtime reason | Capture planned time, run time, total count, good count, ideal cycle time, and stop reasons. | Connect machine controls, sensors, quality systems, and production dashboards using standardized data structures. |
| Food safety control | Inspection and traceability | 100% critical-point verification where required by the process | Monitor critical process parameters such as temperature, weight, seal integrity, coding, and foreign-material detection. | Integrate inspection results with batch records, alarms, reject confirmation, and electronic traceability. |
| Labor efficiency | Manual handling reduction | Measure labor hours per 1,000 good units | Compare baseline labor input with automated feeding, packing, inspection, and palletizing requirements. | Automate repetitive handling while retaining operator access for replenishment, sanitation, quality checks, and maintenance. |
| Maintenance readiness | Unplanned downtime control | Track mean time between failures and mean time to repair | Use downtime codes and maintenance records to identify recurring component, sensor, or setup problems. | Prioritize condition monitoring, accessible components, diagnostics, planned maintenance, and operator training. |
Calculation basis: Throughput examples use an 8-hour scheduled shift, a constant nominal machine rate, 85% OEE, and no additional deductions outside the OEE calculation. Actual results vary with product format, sanitation frequency, changeover requirements, material properties, staffing, and regulatory controls.
Safety must shape automation decisions, not merely follow them. A fast line still fails if it cannot control contamination risks or prove compliance.
HACCP planning should identify hazards around filling, sealing, labeling, and material handling. Sensors can monitor temperature, seal pressure, metal detection, and cleaning intervals. Operators need documented corrective actions, not just alarm screens. A rejected pouch should move into a locked, traceable area. That small physical detail prevents accidental release.
In the United States, packaging systems should support FDA food-contact requirements and applicable current good manufacturing practices. Use controlled material specifications, supplier declarations, lot records, and change-control procedures. Automation cannot make an unsafe material acceptable. It only makes mistakes happen faster.
The EU Packaging and Packaging Waste Regulation adopted in 2025 increases pressure on recyclability, material reduction, labeling, and packaging data. Many obligations apply from later dates, so teams should check the exact transition timeline. Machines may need flexible format handling and reliable data capture for packaging weights and composition. A weak database becomes a compliance risk.
Real production experience also exposes uncomfortable gaps. Cleaning records may be incomplete. Staff may bypass a sensor during a busy shift. Calibration can drift quietly. These failures are not solved by buying more equipment. They require practical validation, trained people, and regular review of real line behavior. Safety improves when the system is designed for human mistakes.
Food packaging automation should be judged by payback, not impressive machinery alone. In packaging projects, I measure current output, labor hours, scrap, changeover time, and unplanned stops. These figures create a reliable baseline before equipment selection begins.
A practical payback model includes equipment, integration, training, maintenance, utilities, and production downtime. Divide the total investment by monthly net savings. For example, a line costing $420,000 may save $28,000 monthly through labor efficiency, lower waste, and higher throughput. The simple payback is 15 months. However, this calculation can mislead. Demand may fall, staffing costs may change, and savings may remain theoretical.
Deployment should start with a controlled production trial. Run one product family for four to eight weeks. Track actual cases per hour, labor allocation, reject rates, changeover minutes, and emergency repairs. Keep manual backup capacity during the early phase. It feels inefficient, but it protects customer deliveries. Training also needs measurable targets, such as fault recovery under five minutes and documented daily inspections. A successful line should reach stable performance before expansion. Not every bottleneck disappears. Sometimes automation exposes poor material flow, inconsistent package dimensions, or weak maintenance routines. Those problems require process changes, not faster machines. Payback improves when operators, engineers, and finance teams review the same weekly data.